Interactive Gantt Chart Planning for Custom Project Tools
Visualise project timelines, dependencies, and milestones on an interactive Gantt chart built into your custom project management platform.
A project plan locked inside a spreadsheet is a project plan that nobody looks at. Gantt charts bring timelines to life by laying tasks out visually on a horizontal axis, making it immediately obvious how activities overlap, which tasks depend on others, and where the critical path runs. For project managers who coordinate multiple teams and track dozens of deliverables, a Gantt view is indispensable. But the generic Gantt features in off-the-shelf tools often lack the flexibility to reflect how your organisation actually plans work. A custom-built Gantt module can incorporate your specific task taxonomy, milestone definitions, approval gates, and reporting conventions. It becomes a planning instrument that matches your methodology rather than forcing you to adapt to someone else’s.
How does it work?
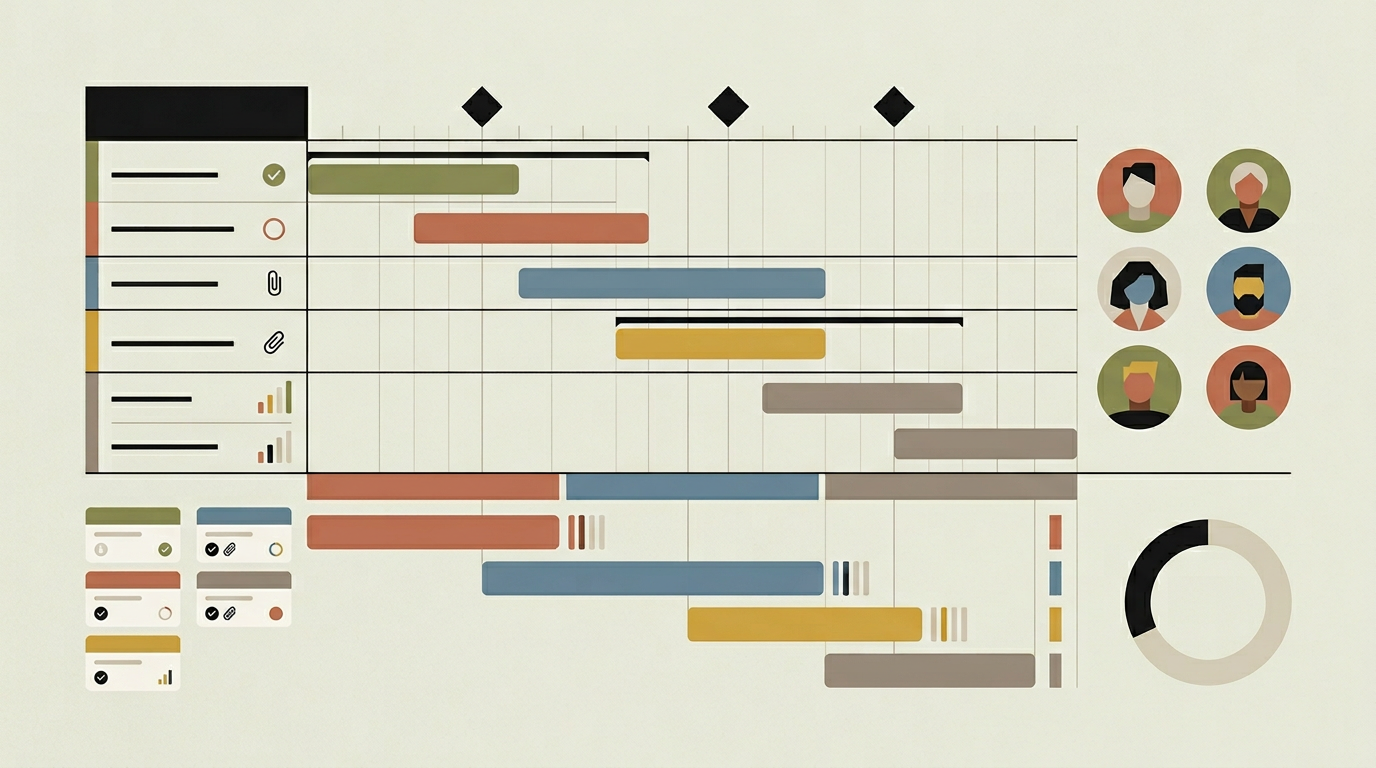
The Gantt module renders project tasks as horizontal bars on a timeline. Each bar represents a task with a start date, end date, and percentage complete. Tasks can be grouped under phases or work packages, and nested groups can be collapsed or expanded. Dependency arrows connect tasks that have finish-to-start, start-to-start, finish-to-finish, or start-to-finish relationships. When a task’s schedule changes, the dependency engine recalculates downstream dates automatically, highlighting any scheduling conflicts or violations. The critical path, the longest chain of dependent tasks that determines the project’s minimum duration, is visualised with a distinct colour so managers can see exactly which activities cannot slip without delaying the whole project. Milestones appear as diamond markers on the timeline, often tied to client deliverables or contractual deadlines. Users interact with the Gantt by dragging task bars to reschedule, stretching them to change duration, and drawing dependency arrows between tasks. A zoom control lets users switch between day, week, month, and quarter views. Resource loading indicators can optionally overlay the Gantt to show where team members are over-allocated. The module stores all schedule data in the project database, so changes made in the Gantt view are immediately reflected in task lists, dashboards, and reports.
Capabilities
Drag-and-Drop Scheduling
Reschedule tasks by dragging their bars along the timeline. Dependent tasks shift automatically to maintain their relationships.
Dependency Management
Supports finish-to-start, start-to-start, finish-to-finish, and start-to-finish dependency types with automatic downstream rescheduling.
Critical Path Visualisation
Highlights the longest chain of dependent tasks so project managers can focus attention on the activities that determine the delivery date.
Multi-Level Grouping
Organises tasks under phases, work packages, or custom groupings that can be collapsed and expanded for high-level or detailed views.
Milestone Tracking
Displays key delivery points and contractual deadlines as diamond markers, with alerts when milestones are at risk due to schedule drift.
Integration options
Task Management Backend
Every change made in the Gantt view writes back to the project task database, keeping list views, Kanban boards, and reports in sync.
Resource Calendar
Overlays team availability and holidays onto the Gantt timeline, allowing schedulers to account for capacity when planning.
PDF / Image Export
Generates a high-resolution Gantt chart image or PDF for inclusion in client reports, board presentations, or print-outs.
Implementation steps
- 1
Task Model Extension
Extend the project task schema with start/end dates, dependency links, milestone flags, and phase groupings.
- 2
Gantt Renderer
Build the interactive timeline component with virtualised row rendering, drag-and-drop scheduling, and dependency arrow drawing.
- 3
Dependency Engine
Implement the scheduling logic that recalculates dates downstream when a task changes, detects circular dependencies, and identifies the critical path.
- 4
Export Module
Develop the PDF and image export functionality that captures the current Gantt view at print-quality resolution.
- 5
User Testing
Run usability sessions with project managers to validate the interaction model, performance with realistic data volumes, and export quality.
User experience
The Gantt chart loads instantly even for projects with hundreds of tasks, thanks to virtualised rendering that only draws visible rows. A toolbar provides quick access to zoom levels, filters, and the critical path toggle. Tooltips on hover display task details without leaving the chart view.
Technical stack
Security
Schedule editing permissions are role-based. Team members can view the Gantt but only project managers can modify dates and dependencies. All schedule changes are logged in the project audit trail.
Maintenance
The Gantt renderer may need performance optimisations as project sizes grow. Dependency logic should be regression-tested when task model changes are introduced. Budget approximately 35 hours per year.
Frequently asked questions
Need this functionality in your product?
We build it the way your business actually needs, without unnecessary complexity.
Request a quoteRelated articles
Integrated Time Accounting for Project Management Platforms
Track hours at the task level, generate timesheets, and connect effort data to billing and payroll. Purpose-built time accounting for project teams.
Real-Time Budget Monitoring for Custom Project Platforms
Keep projects financially healthy with live budget tracking, burn-rate alerts, and forecast-to-complete calculations integrated into your project tool.
Project Risk Management Module for Custom Platforms
Identify, assess, and mitigate project risks systematically. A risk register with scoring, ownership, and mitigation tracking built into your project tool.
Project Management Software Purpose-Built for Construction
Construction projects involve dozens of trades, shifting timelines, and tight budgets. A custom project management platform keeps everything on track from foundation to handover.