Deep Customer Analytics Powered by Your CRM Data
Go beyond basic contact records. Analyze customer behavior, lifetime value, churn risk, and engagement patterns with analytics built directly into your CRM.
Most CRMs store contact details and interaction logs but do little to help teams understand what those data points mean. Customer analytics transforms raw CRM data into strategic insight. Which customer segments generate the highest lifetime value? Which accounts show early signs of churn? How does engagement correlate with renewal rates? These questions cannot be answered by looking at individual records. They require aggregation, pattern recognition, and visualization. For B2B companies managing high-value accounts, understanding customer health at a portfolio level is essential for retention planning and growth strategy. For B2C companies with larger customer bases, cohort analysis and segmentation drive targeted campaigns. Building analytics directly into the CRM ensures that insights are always based on the freshest data and accessible in the same interface where sales and success teams already work.
How does it work?
The analytics module operates on an enriched data model that combines CRM records with event streams from connected systems. Every customer interaction, whether email, call, meeting, support ticket, purchase, or product usage event, is timestamped and attributed to the customer record. An aggregation layer computes derived metrics: customer lifetime value (CLV) based on historical revenue, engagement score based on interaction frequency and recency, churn risk score based on declining activity patterns, and net promoter score from survey data. These metrics are stored and updated incrementally to maintain real-time accuracy without heavy batch processing. The analytics dashboard presents multiple views. A portfolio overview shows the customer base segmented by CLV tier, industry, or acquisition channel with trend indicators. A churn risk view ranks customers by their likelihood of churning, with the contributing factors explained. Cohort analysis groups customers by signup date and tracks retention, revenue, and engagement over time. Individual customer profiles display a health score alongside the interaction timeline, giving account managers immediate context before a call. All views support drill-down from aggregate to individual and export to spreadsheet or reporting tools. Custom segments can be saved and monitored, with alerts when a segment shows unusual movement.
Capabilities
Customer Lifetime Value calculation
CLV is computed from historical revenue data with configurable models (historical, predictive, or contractual) per business type.
Churn risk scoring
Declining engagement patterns, support ticket spikes, and usage drops are synthesized into a churn probability score per customer.
Cohort analysis
Group customers by acquisition date, channel, or other attributes and track retention and revenue trends over time.
Engagement scoring
A composite metric reflecting interaction frequency, recency, and depth helps identify at-risk and highly engaged accounts.
Custom segment monitoring
Save dynamic customer segments and receive alerts when a segment composition or key metrics change significantly.
Integration options
Product analytics (Mixpanel, PostHog)
Usage events feed into the engagement and churn models for product-led growth companies.
Support platform (Zendesk, Intercom)
Ticket volume and resolution data contribute to the customer health score.
Billing system (Stripe, Mollie)
Revenue data from the billing system provides accurate CLV calculations and payment behavior insights.
Implementation steps
- 1
Data audit and metric definition
We inventory available data sources and define the metrics (CLV, churn risk, engagement) relevant to your business model.
- 2
Data pipeline enrichment
Event streams from product, support, and billing systems are connected and normalized into the analytics data model.
- 3
Metric computation engine
Aggregation and scoring algorithms are built with incremental updates for real-time accuracy.
- 4
Dashboard development
Portfolio, cohort, churn risk, and individual customer health views are designed and built with interactive drill-downs.
- 5
Alerting and segmentation
Custom segment builder and alert rules are implemented for proactive customer management.
User experience
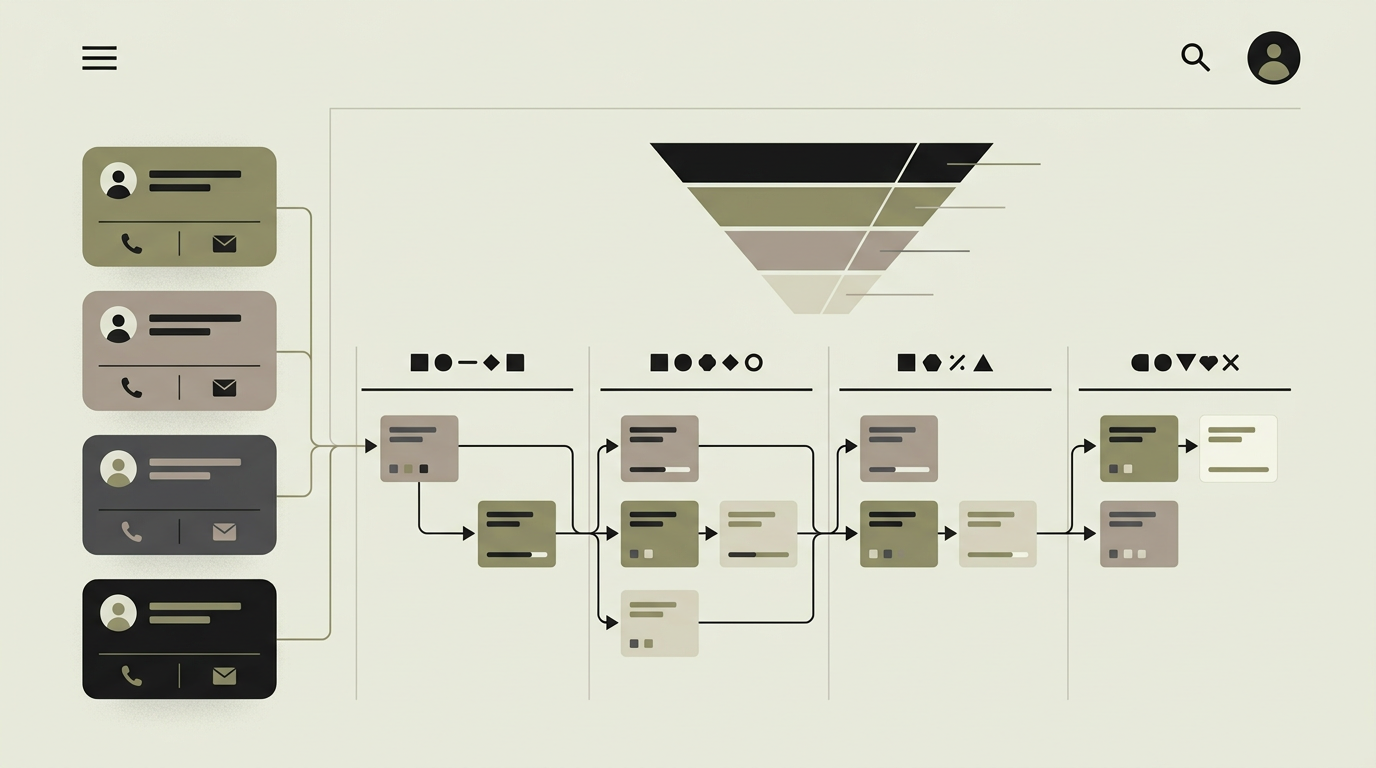
The analytics dashboard sits alongside the CRM contact and deal views. Account managers see a health badge on every customer card. The portfolio view uses interactive charts with hover details and click-to-drill-down. Saved segments appear in a sidebar for quick monitoring.
Technical stack
Security
Analytics views aggregate data across customers, so access is restricted to authorized roles. Individual customer data respects the same CRM access controls. Analytics data used for reporting is anonymized when shared externally.
Maintenance
Model recalibration as your customer base evolves, adding new data sources, and dashboard customization. Budget 4 to 6 hours monthly.
Frequently asked questions
Need this functionality in your product?
We build it the way your business actually needs, without unnecessary complexity.
Request a quoteRelated articles
Your own dashboards with advanced reporting
Combine interactive dashboards with scheduled and ad-hoc reporting. Export polished PDFs, automate weekly digests, and let data speak for itself.
CRM with Intelligent Lead Scoring That Prioritizes Revenue
Stop treating all leads equally. Build a CRM with automated lead scoring that ranks prospects based on behavior, demographics, and engagement so sales focuses on the hottest opportunities.
CRM with Email Automation for Smarter Nurturing
Nurture leads and retain customers with automated email sequences triggered by CRM events. Personalized, timely, and measurable without manual effort.
Retail Analytics Dashboards That Drive Revenue
Unify POS, inventory, and e-commerce data into a single retail dashboard that reveals what sells, what sits, and where to invest next.