Visual Pipeline Management for Your Custom CRM
See every deal at a glance. A visual pipeline with drag-and-drop stages, weighted forecasting, and activity tracking turns your CRM into a revenue operations center.
The sales pipeline is the heartbeat of a revenue-driven organization. Without clear visibility into which deals are in which stage, expected close dates, and potential revenue, forecasting becomes guesswork and bottlenecks go unnoticed. Many teams outgrow their spreadsheet-based pipelines quickly but find off-the-shelf CRM tools too rigid or too bloated. A custom pipeline management module lets you model your actual sales process, not a generic one. Each stage reflects how your team sells, with custom fields that capture the information that matters for your business. Visual drag-and-drop management gives sales leaders an instant snapshot of pipeline health, while underlying analytics reveal where deals stall, how long each stage takes, and what the weighted forecast looks like for the coming quarter.
How does it work?
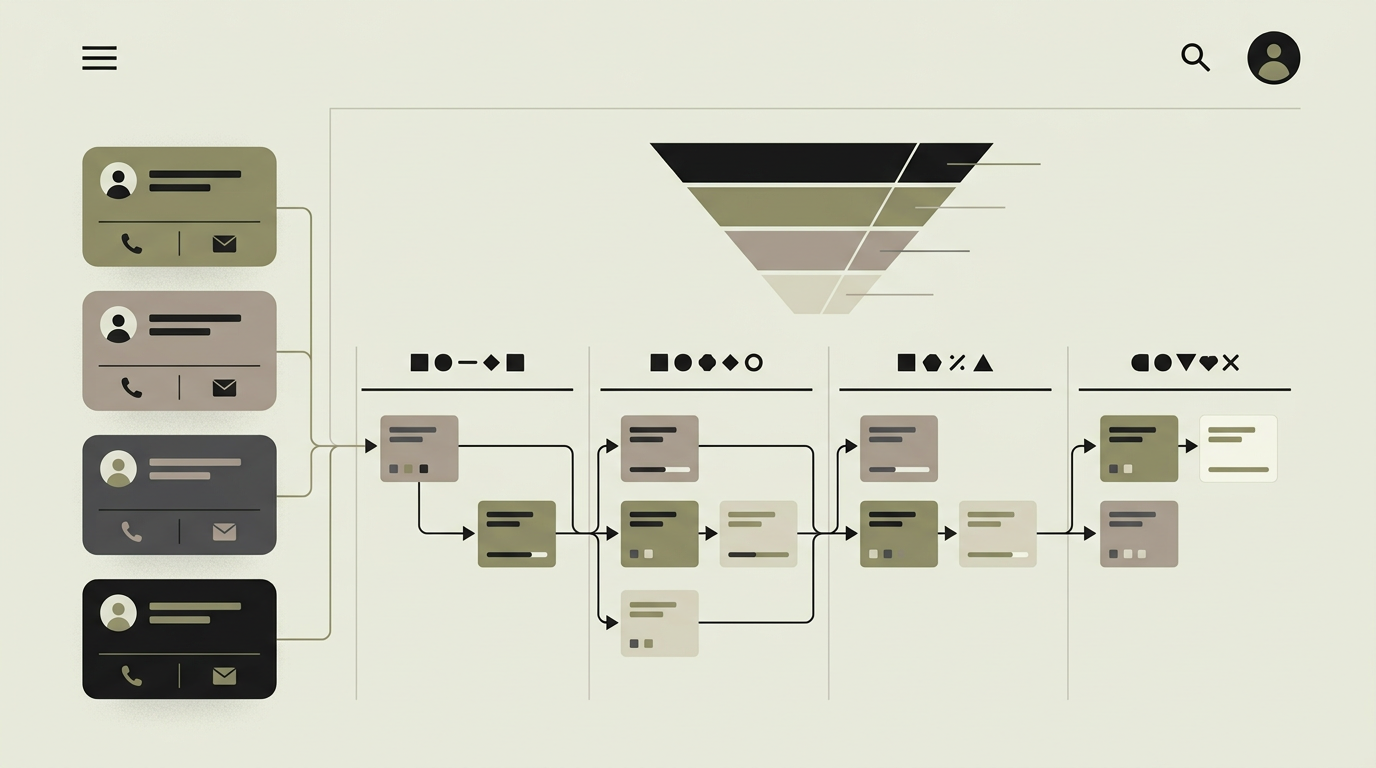
The pipeline module presents deals as cards on a Kanban-style board. Each column represents a stage in your sales process (e.g., Qualification, Proposal, Negotiation, Closed Won, Closed Lost). Dragging a card between columns updates the deal stage and triggers any associated automations, such as sending a notification to the account executive or updating a field. Each deal card displays the most critical information at a glance: company name, deal value, expected close date, and the assigned rep. Clicking a card opens the deal detail view with the full interaction history, associated contacts, attached documents, and upcoming tasks. Pipeline stages are fully configurable with custom probabilities. The weighted pipeline calculates expected revenue by multiplying each deal value by its stage probability, giving leadership a forecast that accounts for conversion likelihood. Stale deal detection flags opportunities that have not progressed within a configurable timeframe, prompting reps to act or managers to review. Activity tracking logs every call, email, meeting, and note associated with a deal, building a complete timeline. Filters and views let users segment the pipeline by rep, date range, deal size, or custom attributes. Multiple pipelines can coexist for different products, regions, or business units.
Capabilities
Kanban-style deal board
Visual drag-and-drop interface where deals move through customizable stages, providing an instant pipeline health snapshot.
Weighted revenue forecasting
Stage-specific win probabilities multiply deal values for realistic revenue projections that update in real time.
Stale deal detection
Deals that sit in a stage beyond the expected duration are flagged automatically, preventing pipeline rot.
Activity timeline
Every interaction (call, email, meeting, note) is logged on the deal timeline for complete context on every opportunity.
Multi-pipeline support
Separate pipelines for different products, regions, or sales motions with independent stages and probability models.
Integration options
Email (Gmail, Outlook)
Incoming and outgoing emails are automatically associated with the relevant deal and contact records.
Calendar (Google, Outlook)
Scheduled meetings appear on the deal timeline and count toward activity metrics.
VoIP (Aircall, Twilio)
Call logs with duration and recordings are attached to deals for a complete communication history.
Implementation steps
- 1
Sales process mapping
We document your sales stages, qualification criteria, deal fields, and forecasting methodology.
- 2
Pipeline UI development
The Kanban board, deal detail views, and forecast dashboard are designed and built with responsive performance.
- 3
Automation and activity tracking
Stage change triggers, stale deal alerts, and activity logging from email and calendar are implemented.
- 4
Forecasting engine
Weighted pipeline calculations, trend analysis, and goal tracking are built into the analytics layer.
- 5
Data migration and go-live
Existing deals are migrated from your current system, reps are trained, and the pipeline goes live with monitoring.
User experience
The pipeline board loads in under a second with smooth drag-and-drop. Quick-add lets reps create a deal in three fields. The forecast summary is always visible above the board. Mobile view stacks stages vertically with swipe-to-advance gestures.
Technical stack
Security
Deal visibility can be restricted by territory, team, or individual ownership. Sensitive fields like deal value can be hidden from roles that do not need access. Audit logging tracks every stage change and field modification.
Maintenance
Adjusting stage definitions as the sales process evolves, tuning probability weights based on historical conversion rates, and adding new custom fields. Expect 2 to 4 hours monthly.
Frequently asked questions
Need this functionality in your product?
We build it the way your business actually needs, without unnecessary complexity.
Request a quoteRelated articles
CRM with Intelligent Lead Scoring That Prioritizes Revenue
Stop treating all leads equally. Build a CRM with automated lead scoring that ranks prospects based on behavior, demographics, and engagement so sales focuses on the hottest opportunities.
CRM with Email Automation for Smarter Nurturing
Nurture leads and retain customers with automated email sequences triggered by CRM events. Personalized, timely, and measurable without manual effort.
Deep Customer Analytics Powered by Your CRM Data
Go beyond basic contact records. Analyze customer behavior, lifetime value, churn risk, and engagement patterns with analytics built directly into your CRM.
Pipeline Tools That Match How Your Team Actually Sells
Your CRM should fit your sales process, not the other way around. We compare 6 CRM tools on pipeline management, automation, and reporting depth.